Find and Use the Right Data

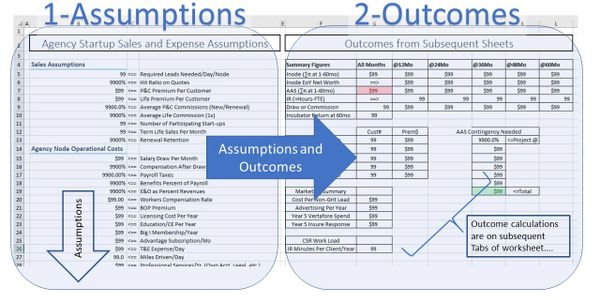
Example 1: See Assumptions => 2-See Outcomes
Building spreadsheets for "What if" analysis is best if those interested in the outcomes can see the results of different assumptions—that is, to be able to change the assumptions (inputs) and see the results on the same sheet. The example here is of an insurance agency start-up pro forma where assumptions and outcomes were made plain. That is, "Cause=>Effect" is easily seen. I like to use a graph to show the outcomes for perspectives plain numbers sometimes do not provide.

Example 2: 50 states, 50 spreadsheet tabs? No Problem!
This is a frequent analysis situation. Data come to you in a single spreadsheet with many tabs (2019, 2018, etc.). All you want is a few figures from each sheet-tab. Going to each worksheet tab is time-consuming. The example shows data for five years from insurer statutory statements.
Use Excel Formula = Indirect (TABNAME, CELLREF).
This lets you "grab" figures and place on a summary sheet the figures you want from each year.

Example 3: Industry Data => Use it!
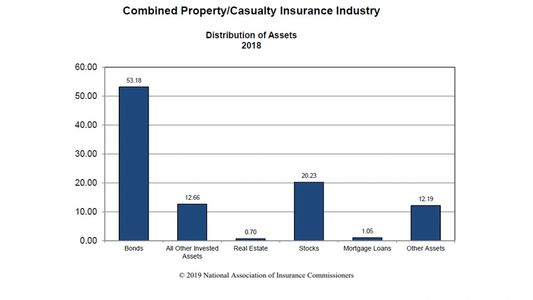
How should your captive invest its assets? Captives and Risk Retention Groups have the responsibility to establish an investment policy. How do similar insurers implement their investment policy with assets invested in the likes of bonds, stocks, real estate? Peer group averages let you scrutinize actual investment policies implementations. You can scan peer insurers easily by obtaining their last statutory statement from the National Association of Insurance Commissioners (NAIC) or use a service. To the right is the NAIC depiction on insurer investments from their annual summary of P&C industry, which is data taken from all insurers at year-end. You can even obtain the actual list of investments from an individual insurer.

Example 4: Is what is alleged even possible?
In this scenario, an agent stands accused of not providing coverage. The agent's position was that the coverage wasn't even available. How does one prove that? It may well be a matter of the public record. You can usually search rate and form filings in the state where the agent operated. In this case, the key question centered on when, exactly, Uninsured Motorist coverage was available.

Example 5: Read the Policy but go get the policy it's usually free!
Bill Wilson, a noted industry policy language expert has a simple piece of advice: read the entire policy. His point, of course, is careful reading might not be fun, but it is essential. Every part for reading in the stand industry acronym, DICE (Declarations, Insuring Agreement, conditions, and Exclusions) is crucial. Shortcuts and skimming do not work—period. By the way, if you don't have the policy you can probably get it from the state where the policy is used because most states require that almost all policies, be filed and approved. Those are generally available for the asking.

Example 6: Incentive Compensation, Theory and Practice
I once had a professor in compensation theory who liked to say, “Formulas have consequences.” He was right: actual attention to affected employees is more important than anything one merely says. If you want to foster behavior, make sure you pay for it. In too many insurance agencies, the trouble starts with how they stop at tracking premiums and commissions down to "net revenues." I counsel the approach illustrated here. Obtain a transaction report with gross commissions (#1). Those calculations are then matched with a Master Policy List (#2). Rules are applied based on net revenues (#3) and outcomes are totaled, by person (#4).
Copyright © 2020 Real Insurance Solutions Consulting - All Rights Reserved.